5G Network RF Planning – Link Budget Basics
5G Link Budget Basics
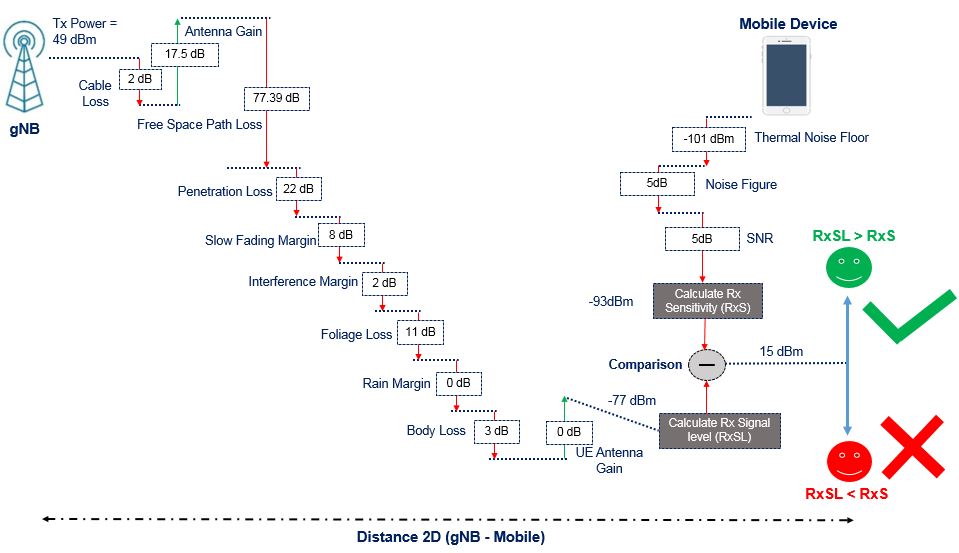
The link budget is the calculation of total gain and loss in the system to conclude the received signal level (RxSL) at the receiver (UE). The received signal level is then compared to the receiver sensitivity (RxS) to check if the channel status is pass or fail.
The channel status is “Pass” if the received signal level (RxSL) is better than the reception sensitivity (RxS), else it is “Fail”. Below is figure shows some example values to illustrate the different inputs parameters used for the link budget calculation:
The following formula is used to calculate the 5G link budget received signal level (RxSL) :
Received Signal Level at receiver (dBm) = gNodeB transmit power (dBm) – 10*log10 (subcarrier quantity) + gNodeB antenna gain (dBi) – gNodeB cable loss (dB) – Path loss (dB) – penetration loss (dB) – foliage loss (dB) – body block loss (dB) – interference margin (dB) – rain/ice margin (dB) – slow fading margin (dB) – body block loss (dB) + UE antenna gain (dB) …………………(1)
In the above figure example the RxSL calculated value is 77 dBm and the reception sensitivity (RxS) is -93 and the link status is “Pass”. Usually the limiting link is the uplink and it is recommended to calculate downlink and uplink link budget separately and then consider the worst link.
To calculate the path loss, we need to use suitable propagation model for 5G (5G use 3D propagation models defined in 3GPP 36.873. The UMa, UMi, and RMa models are applicable to frequency bands 2–6 GHz and then are extended to 0.5–100 GHz in 3GPP 38.901).
For example and if we consider the UMa model for Line Of Sight (LOS) case, the path loss formula is given as following :
Path loss =28.0+22*log10(d)+20 log10( fc) …………………(2)
It is clear from above formula and to calculate the path loss, we require the information of “d” which is the distance between the transmitter and receiver (cell radius) and the center frequency (fc). If the cell radius correspond to max cell range, then the path loss will correspond to maximum allowed path loss (MAPL).
Once we know the value of path loss , then it is possible to calculate the received signal level which will be compared to the receiver sensitivity
Receiver sensitivity, depend on Thermal noise power (dBm), noise figure (dB), demodulation threshold SINR (dB). The receiver sensitivity is calculated using below formula:
Receiver sensitivity (dBm) = Noise figure (dB) + Thermal Noise (dBm) + SINR (dB) ……… (3)
The Thermal noise is calculated using following formula : K * T * BW where “K” is Boltzmann constant and “T” is the temperature in Kelvin and “BW” is the bandwidth.
The Noise Figure and SINR are vendor specific values which depend mainly on hardware performance and Modulation Coding Scheme decoding performance.
You can implement the equation (1) into excel and vary the cell radius until the receive signal level is better or equal to receiver sensitivity.
In case you want to conclude directly what will be the cell radius that correspond to specific reception sensitivity , we can use the link budget formula (1) and replace the Received Signal Level at receiver (dBm) with the reception sensitivity.
The reception sensitivity is equal to:
Thermal noise power (dBm) + UE noise figure (dB) + demodulation threshold SINR (dB) ……(4)
By replacing the formula (4) into (1), the path loss is equal to:
Path loss (dB) = gNodeB transmit power (dBm) – 10*log10 (subcarrier quantity) + gNodeB antenna gain (dBi) – gNodeB cable loss (dB) – penetration loss (dB) – foliage loss (dB) – body block loss (dB) – interference margin (dB) – rain/ice margin (dB) – slow fading margin (dB) – body block loss (dB) + UE antenna gain (dB) – Thermal noise power (dBm) – UE noise figure (dB) – demodulation threshold SINR (dB) ……………………..(5)
Once the path loss is calculated and by knowing the center frequency , we can conclude the cell radius by using path loss formula :
Path Loss (PL) =28.0+22 log10( d)+20 log10( fc) ………….(6)
We conclude the cell radius “d” from formula (5) and it is given by bellow formula:
Distance (d) = 10 Power ((PL-28-20*Log10(fc))/22) ………………..(7)
Example if path loss is equal to 78.4 dB , then the Cell radius is 120m !
Looking back to path loss formula (5), we conclude that the main factor controlling the value of path loss is the demodulation threshold SINR (dB) which means for higher SINR values (better modulation), the path loss is lower and therefore the Cell radius is smaller ! … more number of 5G base stations are required.
Use case of link budget
Till now, hope you have got a good idea about link budget calculation and if so , it is clear that link budget allow us to either calculate the cell radius (R) by a given receiver sensitivity or calculate the received signal level (RSL) for a given cell radius and compare the same to the reception sensitivity to check the channel status (Pass or Fail).
The reception sensitivity is mainly based on the capacity requirements (throughput) as SINR value is directly linked to how much throughput we want to achieve at the cell edge !
By knowing the cell radius (R), we can conclude the square area cover by one base station using below formula :
Coverage Area =pi *R^2 ………………(8)
Finally, the required number of 5G base station can be calculated as following
#5G gNodeB = (Total surface area of the cluster in Sq Km / Coverage Area of Single gNB) ….(9)
Knowing the number 5G base station required for given cluster is very much required for pre-sale activities since creating the project in planning tool is time taking.
One of the main use case of link budget is pre-sale activity for 5G deployment proposal. Knowing the number of 5G sites will help the vendor and operator to estimate the cost and effort. Link budget calculation allow us also to estimate the achieved capacity based on different quality requirements (SINR).
Can we design a network just based on link budget calculation and ignore the use of planning tool?
The answer is “NO” as the link budget calculation will not provide the location of sites (latitude and longitude). Also even if the sites location are given based on existing 4G location, there is no option in link budget to run a 5G site selection!
Planning tools like Planet, Atoll, Asset,.. offer the functionality of site selection and 5G green field planning.
Can link budget output be used as inputs for planning tool? if yes which are theses inputs?
As said earlier, one of the main outputs of link budget are:
- Cell radius
- Number of 5G required base station
- Achieved capacity and throughput (at cell edge)
It is possible also to get above outputs using a planning tool but it will require time to create the project and import the physical data, maps , network configuration and running of prediction and analysis.
The key factor for both calculation (link budget or planning tool) is the used propagation model ! Even same propagation model is used in Link budget and planning tool, the cell radius will be different ! The planning tool use complex calculation based on the terrain model, clutter and buildings information and consider the propagation factors such as reflection, diffraction and details calculation for the attenuation caused by different obstacle (building, trees,..).
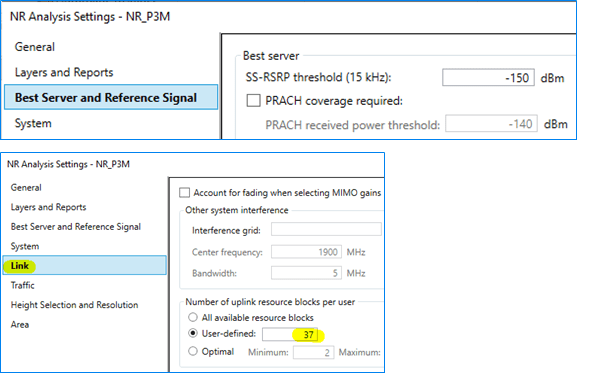
Detail analysis on planning tool require to run Monte Carlo simulation and that is more time taking and detail inputs are required (user maps,..). To run static analysis in planning tool some of the inputs like the SS-RSRP Threshold and up link number of resource block per user can be obtained from the link budget simulation.
Below figure is showing NR Analysis settings in Planet tool:
It is possible to use planning tool outputs into link budget calculation?
In case 3D maps are available, it is possible to create 5G project and place different sites into different clutter type (Ex: Dense Urban, Urban, Sub Urban and Rural) and run 3D prediction (using 3D models like Planet P3M, Planet Universal model, Atoll Aster or Atoll CrossWave,..). The prediction can be further calibrated with CW using CW measurement.
The idea is to measure the obtained cell radius at similar coverage threshold which is used in Link budget calculation (Ex: reception sensitivity) and try to adjust the propagation model in link budget till having the similar radius from the planning tool. It is kind of calibration of the link budget propagation model.
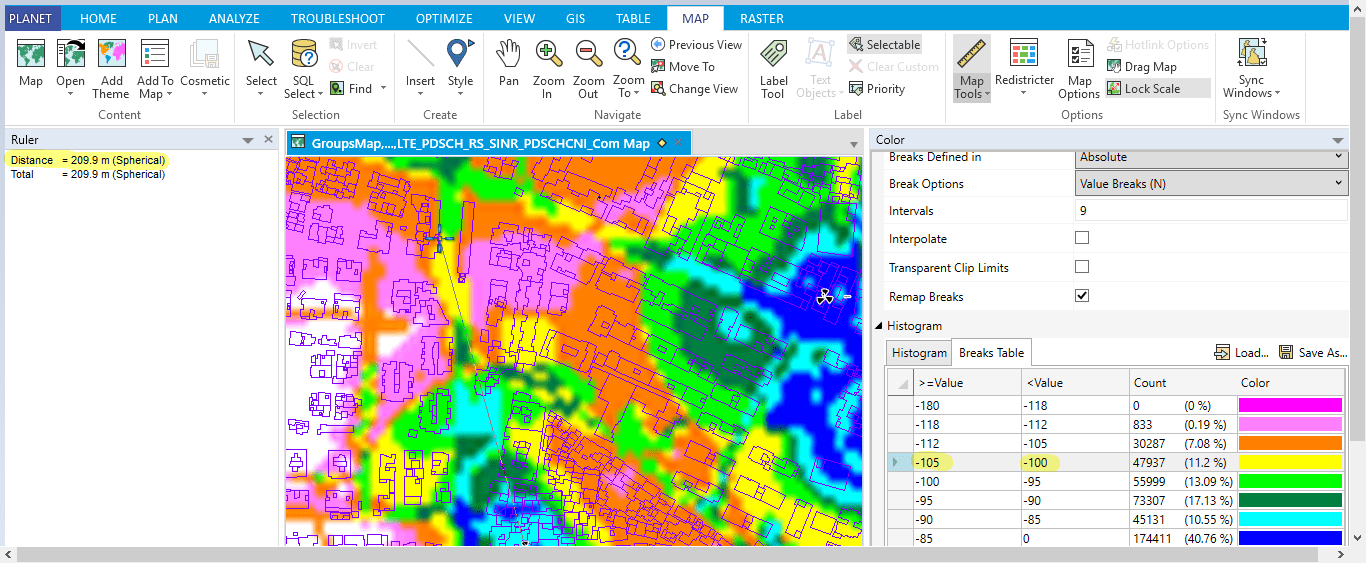
Below figure is showing an example of cell radius of 209 m measured at level between -100 ~ -105 dBm.
Can link budget calculation compliment and verify a network designed based on planning tool?
If no much deviation in the used propagation model, link budget may provide fair estimation of the number of sites which can be fine tuned further with deep dive design using planning tool.
To conclude the article, the link budget calculation is a fast way to estimate the coverage and capacity requirements and the output is not necessary to be correlated to planning tool based radio design.
Author
Article is submitted by Rachid Lamali (Solution Architect at Ericsson)