“The world’s most accurately measured Wi-Fi network”Just Right Networks
Last week scrolling through my emails, I found an email which had the subject “The world’s most accurately measured office Wi-Fi network”, which immediately caught my attention. Here is my study and summary of the same email and method of studying the Wi-Fi network. I would like to thanks Martin for sharing great study material and insights.Here is summary of the blog, so to know before hand if this is of interest to you.
- We all face issue with Real time/ Video applications not so much with browsing,
- QOS is the most important parameter and not fat pipe or more data speed which is supposed to be the only solution.
- To solve the issue, we need to understand the issue first ,Delay and Loss.
- Delay depends on G,S,V. Each play an important role.
- Averaging, counter KPIs, Equipment specific data collection is WRONG interpretation.
- Studying data packet timeline end to end to understand behavior of packet w.r.t media, space and time.
The article hits the nail (issues) on the head, mentioning in today’s world the most important parameter is the QOS, quality of service. Also highlighting that, If we noticed with our enterprise and home Wi-Fi networks we always have issues with video / real time applications and not so much with non-real time services such as browsing. And when we ask operators/customer care about the same the answer will be “Enhance/increase your data package speed”. As correctly, mentioned in the email the Quality is being compared to the quantity/how the fat the pipe is.
“You can’t solve a quality problem later if it isn’t ‘just right’ in the first place” and Just buy more bandwidth is not the solution.
What made the same email more interesting was highlighting whats wrong with current troubleshooting methods:
“The challenge is that packet networks are systems that involve very rapid changes, all of which affect the delivered QoE. For example, each packet sent over a WiFi link might encounter a slightly different radio environment, as people move around an office. Packets encounter queues along the path with constantly varying size. They can also take very different routes, which will have varying length and speed.”
Delay, Loss and Quality of service
My interest kept increasing as I could feel related and found the study very interesting. I replied the email hoping I would reach the right person. I got reply from Martin. He shared some of the best webinar videos ( mentioned in the end) on network troubleshooting and optimization along with some study material.
To make it simpler to understand I have created summary of the same here. Quality of service is directly related to the delay and packet loss. We will see which parameters affect delay and current method of troubleshooting the same.
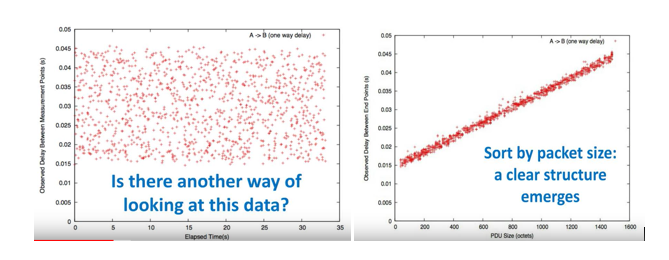
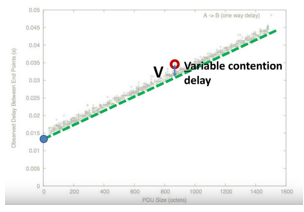
Let us study network data collected. The below is the distribution of Time vs delay between two points. But can be make some value out of the data, also Instead of loss and delay for each packet, the distribution of delay was plotted wr.t. Packets of particular size. The second graph shows clear relation of packet size and the delay.
Components of Network Delay:
Let’s see various components of the delays:G,S,V
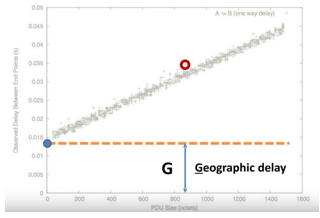
- First immediate observation is that size of packet directly relates to the delay as shown above.
- Then there is minimum delay which is contributed by network, switches, backhaul etc. which is minimum switching delay.
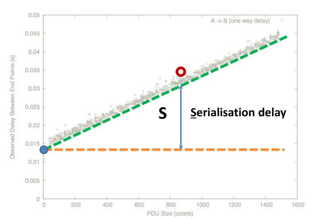
- Serialization and de-serialization delay for packets.
- Then there is extra something, called the variance, which is the delay which comes from buffer queuing or schedulers , the more queuing the buffer the more we see value of V. Value of V can be optimized by better scheduling method.
There are few things which are not in our hand (network design and standard dependent limitations). We can change/optimize G by changing reference network design, we have been changing S, as the link rates are changing with evolution but what about V ? To reduce delay and for V we need to work on schedulers.
“S” has been reducing, as the link rates are going higher. So even if you own a 10G pipe at your home, you will still/can have issues because of V and G. Hence changing the data rate plan might not help/
Troubleshooting starts with understanding the issues:
Below are the key points mentioned in the webinars and suggested as correct methods.
- Paths not points: Utilization of a link, how hot is the router/point is not correct way.
- Distribution and not averages to study network: Studying network over averages or 15minutes is not correct
- Structure for understanding and prediction: Need to understand where the overall delay is is coming from G, S or V?
See the example below shows two Broadband connections at same location, clearly shoes having link speed is not the answer it is important to take all three parameters into account.

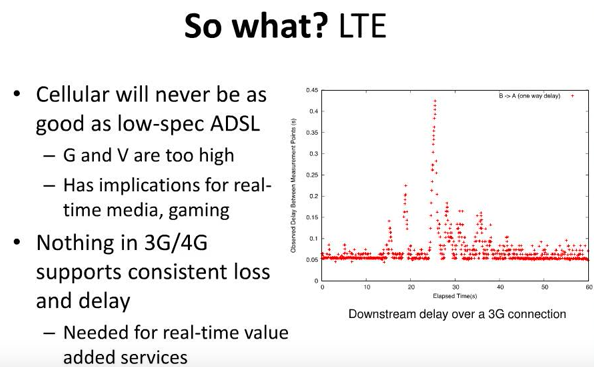
Similarly for wireless broadband, this charts shows how G and V are too high and how fundamentally we observe more delay due to High V due to shared media.
Delta Q and importance to study and troubleshoot network:
The timeliness of outcomes is dependent on the end to end loss and delay characteristics. This is called end to end property delta Q. This applies end to end and round trip.
Delta Q takes into account the instantaneous properties of the packet timeline end to end. To understand the characteristics, delay at each point in time and space. It is very important to understand characteristic not the averages of link, measuring traffic during office hours will always show congestion but that is not the reality hence averages are not the correct measurements.
∆Q is a new branch of mathematics that sits under probability theory that quantifies this quality attenuation. It extends the idea of randomness to include the idea of non-termination, so we can reason about how long things take and whether they might not happen at the same time. You can think of this as being analogous to how imaginary numbers extend real numbers in complex analysis. In the case of networking, this unifies the varying quantity (e.g. packet delay) with ‘non-events’ (e.g. packet loss). This forms the basis of a new science of network performance.
Methods studied currently are limited because they are:
- Not indicator of how the packet travel experience would be, not end to end
- Based on counters (packet dropped, packet sizes etc.)
- Equipment centric (Heavily utilized equipment’s, 80% loaded) and not service based.
- Focus on capacity and not on schedulability.
Thank you for sharing such great insight and information Martin,

Martin Geddes is an authority on the future of the telecoms industry, ranging from emerging business models to new network technologies. He is a futurologist, writer, speaker, consultant, and technologist. Martin is currently writing a book, The Internet is Just a Prototype, on the future of distributed computing.
He is formerly Strategy Director at BT’s network division, and Chief Analyst and co-founder at Telco 2.0. Martin previously worked on a pioneering mobile web project at Sprint, where he was a named inventor on nine granted patents, and at Oracle as a specialist in high-scalability databases.
you may reach out him at martin@justright.network or www.justright.network or Twitter at @wearejustright
- 5G Network Sharing: Concept, Benefits and Architectures
- Hybrid Core Network – 4G Core to 5 G Core Interconnection
- Deployments Scenarios for 5G-NR
- 5G Key Performance Indicator Definitions Template by 3GPP
- 5G End to End KPI – Accessibility, Integrity and Utilization
- 5G NR gNB Logical Architecture and Its Functional Splits
- 5G NR gNB High Layer Split
- 5G NR Interfaces X2/Xn, S1/NG, F1 and E1 Functions
- 5G Channel Modes: Requirements and Deployment Scenarios
- 5G Self Backhaul- Integrated Access and Backhaul
- 5G Transport Network Requirement for Indian Telecom
- 5G NG Identities (UE and Network Identifiers)
- 5G NR Radio Protocol Stack (Layer 2 and Layer 3)
- 5G NR User Plane Protocol