Prometheus Application : Open Source Application
Prometheus is an open source software application used for event monitoring and alerting. It records real-time metrics in a time series database (allowing for high dimensionality) built using a HTTP pull model, with flexible queries and real-time alerting. It is now a standalone open source project and maintained independently of any company. To emphasize this, and to clarify the project’s governance structure, Prometheus joined the Cloud Native Computing Foundation in 2016 as the second hosted project, after Kubernetes.
The project is written in Go and licensed under the Apache 2 License, with source code available on GitHub.
Architectural Components
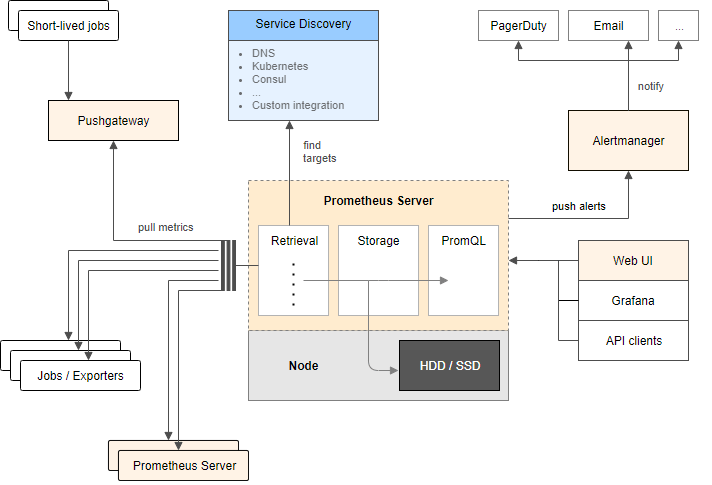
The Prometheus ecosystem consists of multiple components, many of which are optional:

Prometheus Server
Prometheus collects data in the form of time series. The time series are built through a pull model: the Prometheus server queries a list of data sources (sometimes called exporters) at a specific polling frequency. Each of the data sources serves the current values of the metrics for that data source at the endpoint queried by Prometheus. The Prometheus server then aggregates data across the data sources.
Client libraries
Before you can monitor your services, you need to add instrumentation to their code via one of the Prometheus client libraries. These implement the Prometheus metric types.
Choose a Prometheus client library that matches the language in which your application is written. This lets you define and expose internal metrics via an HTTP endpoint on your application’s instance:
- Go
- Java or Scala
- Python
- Ruby
And there are few unofficial third-party client libraries like C, C++, Perl, PHP etc.
When Prometheus scrapes your instance’s HTTP endpoint, the client library sends the current state of all tracked metrics to the server.
Storage
Prometheus includes a local on-disk time series database, but also optionally integrates with remote storage systems.
Prometheus’s local time series database stores time series data in a custom format on disk.
Prometheus’s local storage is limited by single nodes in its scalability and durability. Instead of trying to solve clustered storage in Prometheus itself, Prometheus has a set of interfaces that allow integrating with remote storage systems.
PromQL
Prometheus provides its own query language PromQL (Prometheus Query Language) that lets users select and aggregate data. PromQL is specifically adjusted to work in convention with a Time-Series Database and therefore provides time-related query functionalities. Examples include the rate() function, the instant vector and the range vector which can provide many samples for each queried time series.
Pushgateway
The Prometheus Pushgateway exists to allow ephemeral and batch jobs to expose their metrics to Prometheus. Since these kinds of jobs may not exist long enough to be scraped, they can instead push their metrics to a Pushgateway. The Pushgateway then exposes these metrics to Prometheus.
The Pushgateway is explicitly not an aggregator or distributed counter but rather a metrics cache. The metrics pushed are exactly the same as you would present for scraping in a permanently running program.
Exporters
There are a number of libraries and servers which help in exporting existing metrics from third-party systems as Prometheus metrics. This is useful for cases where it is not feasible to instrument a given system with Prometheus metrics directly (for example, HAProxy or Linux system stats).
You can find a list of exporters at following link:
https://prometheus.io/docs/instrumenting/exporters/
Alertmanager
The Alertmanager handles alerts sent by client applications such as the Prometheus server.
Alerting with Prometheus is separated into two parts. Alerting rules in Prometheus servers send alerts to an Alertmanager. The Alertmanager then manages those alerts, including silencing, inhibition, aggregation and sending out notifications via methods such as email, on-call notification systems, and chat platforms.
Dashboard
Prometheus is not intended as a dashboarding solution. Although it can be used to graph specific queries, it is not a full-fledged dashboarding solution and needs to be hooked up with Grafana to generate dashboards.
Grafana supports querying Prometheus. The Grafana data source for Prometheus is included since Grafana 2.5.0 (2015-10-28).
The following shows an example Grafana dashboard which queries Prometheus for data:

Why Prometheus
Prometheus works well for recording any purely numeric time series. It fits both machine-centric monitoring as well as monitoring of highly dynamic service-oriented architectures. In a world of microservices, its support for multi-dimensional data collection and querying is a particular strength.
Prometheus is designed for reliability, to be the system you go to during an outage to allow you to quickly diagnose problems. Each Prometheus server is standalone, not depending on network storage or other remote services. You can rely on it when other parts of your infrastructure are broken, and you do not need to setup extensive infrastructure to use it. And few other features includes ease of deployment, highly scalable, minimal external dependencies, it is production-ready and most importantly, designed with microservices and distributed architecture in mind.
Usage Trend
Prometheus was first used in-house at SoundCloud, where it was developed, for monitoring their systems. The Cloud Native Computing Foundation has a number of case studies of other companies using Prometheus. These include digital hosting service Digital Ocean, digital festival DreamHack, and email and contact migration service ShuttleCloud. Separately, Pandora Radio has mentioned using Prometheus to monitor its data pipeline.
GitLab provides a Prometheus integration guide to export GitLab metrics to Prometheus, and it is activated by default since version 9.0.
References:
https://prometheus.io/docs/introduction/overview/
https://github.com/prometheus/
https://en.wikipedia.org/wiki/Prometheus_(software)
Related Post


