Spectrum Analyzer
A spectrum analyzer is a laboratory instrument used for analyzing the frequency spectrum of radio frequency, RF and audio signals. It displays signal amplitude (strength) as it varies by signal frequency. Spectrum analyzers are able to make a large variety of measurements and this means that they are an invaluable tool for the RF design development and test laboratories, as well as having many applications for specialist field service.
By analyzing the spectra of electrical signals, dominant frequency, power, distortion, harmonics, bandwidth, and other spectral components of a signal can be observed that are not easily detectable in time domain waveforms. These parameters are useful in the characterization of electronic devices, such as wireless transmitters.
Spectrum analyzers are widely used within the electronics industry for analyzing the frequency spectrum of radio frequency, RF and audio signals.
Block Diagram of a Spectrum Analyzer
The block diagram of a Spectrum Analyzer is shown below. Inside the analyzer, there is a mixer which converts the input signal from one frequency to another. The input signal is applied to one port, and the local oscillator’s (LO) output signal is applied to the other. The mixer is a nonlinear device, so frequencies will be present at the output that weren’t present at the inputs. These frequencies are the original input signals, plus the sum and difference frequencies of the two signals. The difference frequency is called the IF signal.
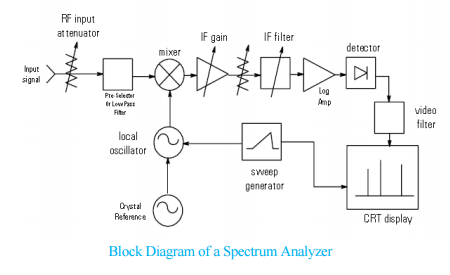 The analyzer’s IF filter is a band pass filter used as a “window” for detecting signals. Its bandwidth, the analyzer’s resolution bandwidth (RBW), can be changed by means of the instrument’s front panel. A broad range of variable RBW settings allows the analyzer to be optimized for different sweep and signal conditions and enables the user to trade off frequency selectivity, signal-to-noise ratio (SNR), and measurement speed. Narrowing RBW, for example, improves selectivity and SNR. However, sweep speed and trace update rate degrade. The optimum RBW setting depends heavily on the characteristics of the signals of interest.
The detector allows the analyzers IF signal to be converted to a baseband or video signal so it can be digitized and viewed on the LCD. This is accomplished with an envelope detector whose video output is digitized with an analog-to-digital converter (ADC) and represented as the signal’s amplitude on the Y-axis of the analyzer display
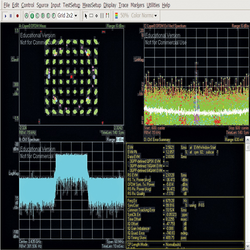
LTE Measurements on Spectrum Analyzer
In general terms, spectrum analyzer measures the basic frequency spectrum related parameters of RF signal like signal power, bandwidth, ACLR, EVM etc. But to decode that particular LTE signal, there is a need of LTE measurement personality in instrument. If have a spectrum analyzer instrument, then you have to buy licenses for that LTE personality in that instrument, then LTE signal will be decoded and other parameters like RE power, OFDM symbol power, EVM will be visible. There are many types of licenses are available from manufacturer like uplink TDD, downlink TDD, uplink FDD, downlink FDD etc. Depending upon the type of requirement, licenses are purchased to cut the cost of buying the whole system.
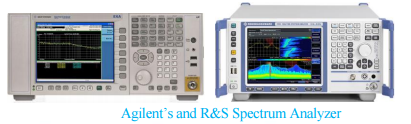
Manufacturers
Four prominent VNA manufacturers are Keysight (previously Agilent Technologies), Tektronix, Anritsu, and Rohde & Schwarz.
Summary
Spectrum analyzers are able to make a large variety of measurements and this means that they are an invaluable tool for the RF design development and test laboratories, as well as having many applications for specialist field service.