Machine Learning – Principal Component Analysis
Machine Learning – Principal Component Analysis
As a machine learning Engineer, we need to work with multifeatured or multi dimensions data sets. As the no. of features or dimensions increased in a dataset, the amount of data required to obtain a statistically correct result increase exponentially.
This increased dataset results into multiple issues for the Machine Learning models such as overfitting, high computational time, and reduced accuracy. This problem is also known as the Curse of Dimensionality arise while working with high-dimensional data.
When no. of dimensions increases, the no. of possible combinations of features increases exponentially, which makes it computationally difficult to obtain a representative sample of the data and it becomes expensive to perform clustering or classification tasks.
In cases Machine Learning algorithms can be sensitive to the no. of dimensions, requiring more data to achieve the same level of accuracy as lower-dimensional data.
To address the problem Curse of Dimensionality, there are some techniques for feature selection and feature extraction are introduced. Dimensionality reduction is a type technique to of feature extraction technique that aims to reduce the number of input features while retaining as much of the original information as possible.
In this article, we will discuss one of the most popular dimensionality reduction techniques i.e. Principal Component Analysis (PCA).
What is PCA?
Principal Component Analysis is a technique that helps to find out the most common dimensions of the dataset and makes result analysis simpler. In the available dataset not all these datasets dimension is critical, some may be the primary key datasets, whereas others are not. So, PCA Method of factor analysis gives a calculative way of eliminating a few extra less important variables, thereby maintaining the transparency of all information.
Principal Component Analysis also called a dimensionality reduction method. With reduced data and dimensions, it is easily to explore and visualize the algorithms without wasting your valuable time.
Therefore, PCA statistically analyze all dimensions and reduce them as much as possible while preserving the exact information.
PCA Key Pointer
- PCA techniques is for data cleaning and data preprocessing.
- To Calculate the PCA use should have fair understanding of following mathematical concepts.
- How to calculate the mean
- How to calculate Covariance
- Matrix Addition, Subtraction, Multiplication and Transpose
- Linear Algebra Concepts like Eigen value and Eigen Vector
- You can monitor multi-dimensional data (can visualize in 2D or 3D dimensions) over any platform using the Principal Component Method of factor analysis.
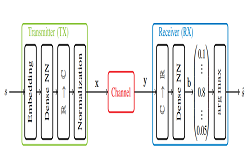
- PCA helps to compress the information and transmit the same using effective PCA analysis techniques, where information processing techniques are without any loss in quality.
- PCA can be used to analyze different dimensions and can be applied in platforms like face recognition, image identification, pattern identification etc.
- As PCA minimizes the more significant variance of dimensions, it can easily denoise the information and completely omit the noise and external factors.
Terminologies of PCA
- Variance– Variance calculates the variation of data distributed across dimensionality of graph.
- Covariance– It calculates dependencies and relationship between features or datasets.
- Standardizing data– It is a process of scaling our dataset within a specific range for unbiased output.
- Covariance matrix– This matrix is used to calculate interdependencies between the features or datasets and helps in reduce the datasets to improve the performance.
- Eigenvalues and Eigenvectors– Eigenvectors’ purpose is to find out the largest variance that exists in the dataset to calculate Principal Component. Eigenvalue means the magnitude of the Eigenvector. Eigenvalue indicates variance in a particular direction and whereas eigenvector is expanding or contracting X-Y (2D) graph without altering the direction.
- Dimensionality Reduction – Under this we Transpose the original data and multiply it by transposing of the derived feature vector. It Reduces the features/datasets without losing information.
Procedure to Calculate Principal Components
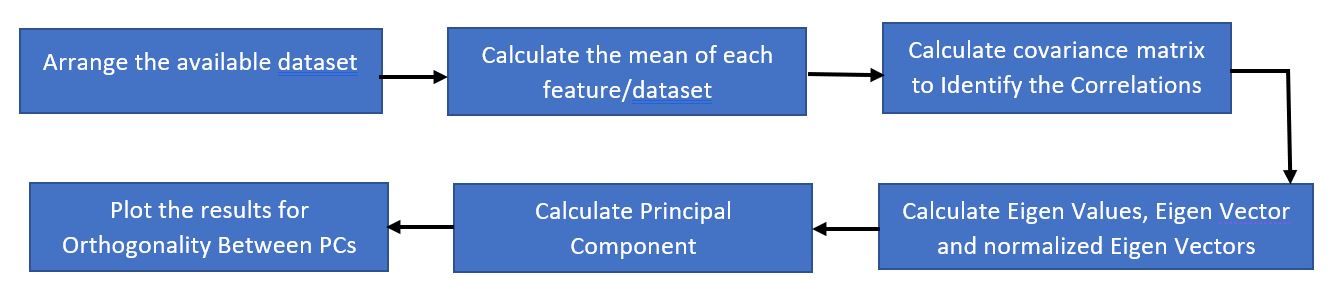
Following figure show the sequence of step we need to follow to calculate the PCA in Machine Learning.
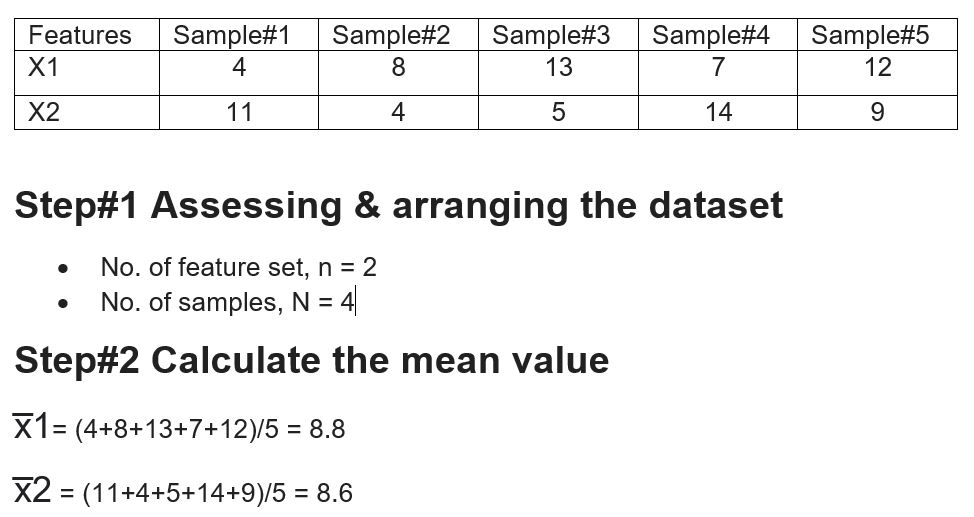
- Arrange the dataset and find out no. of dimensions and no. of samples.
- Calculate the mean of each dataset.
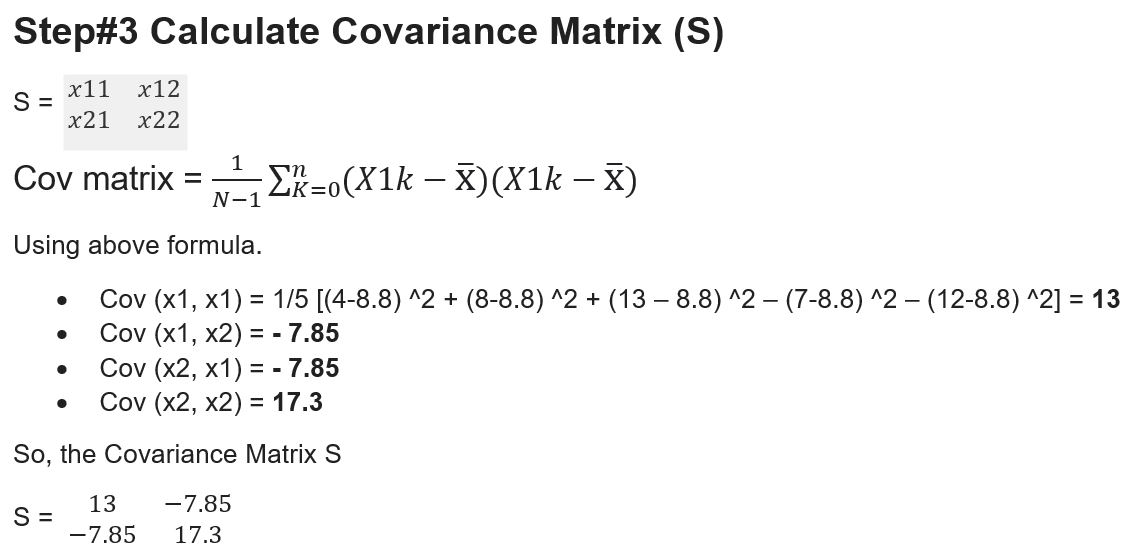
- Calculate the Covariance Matrix
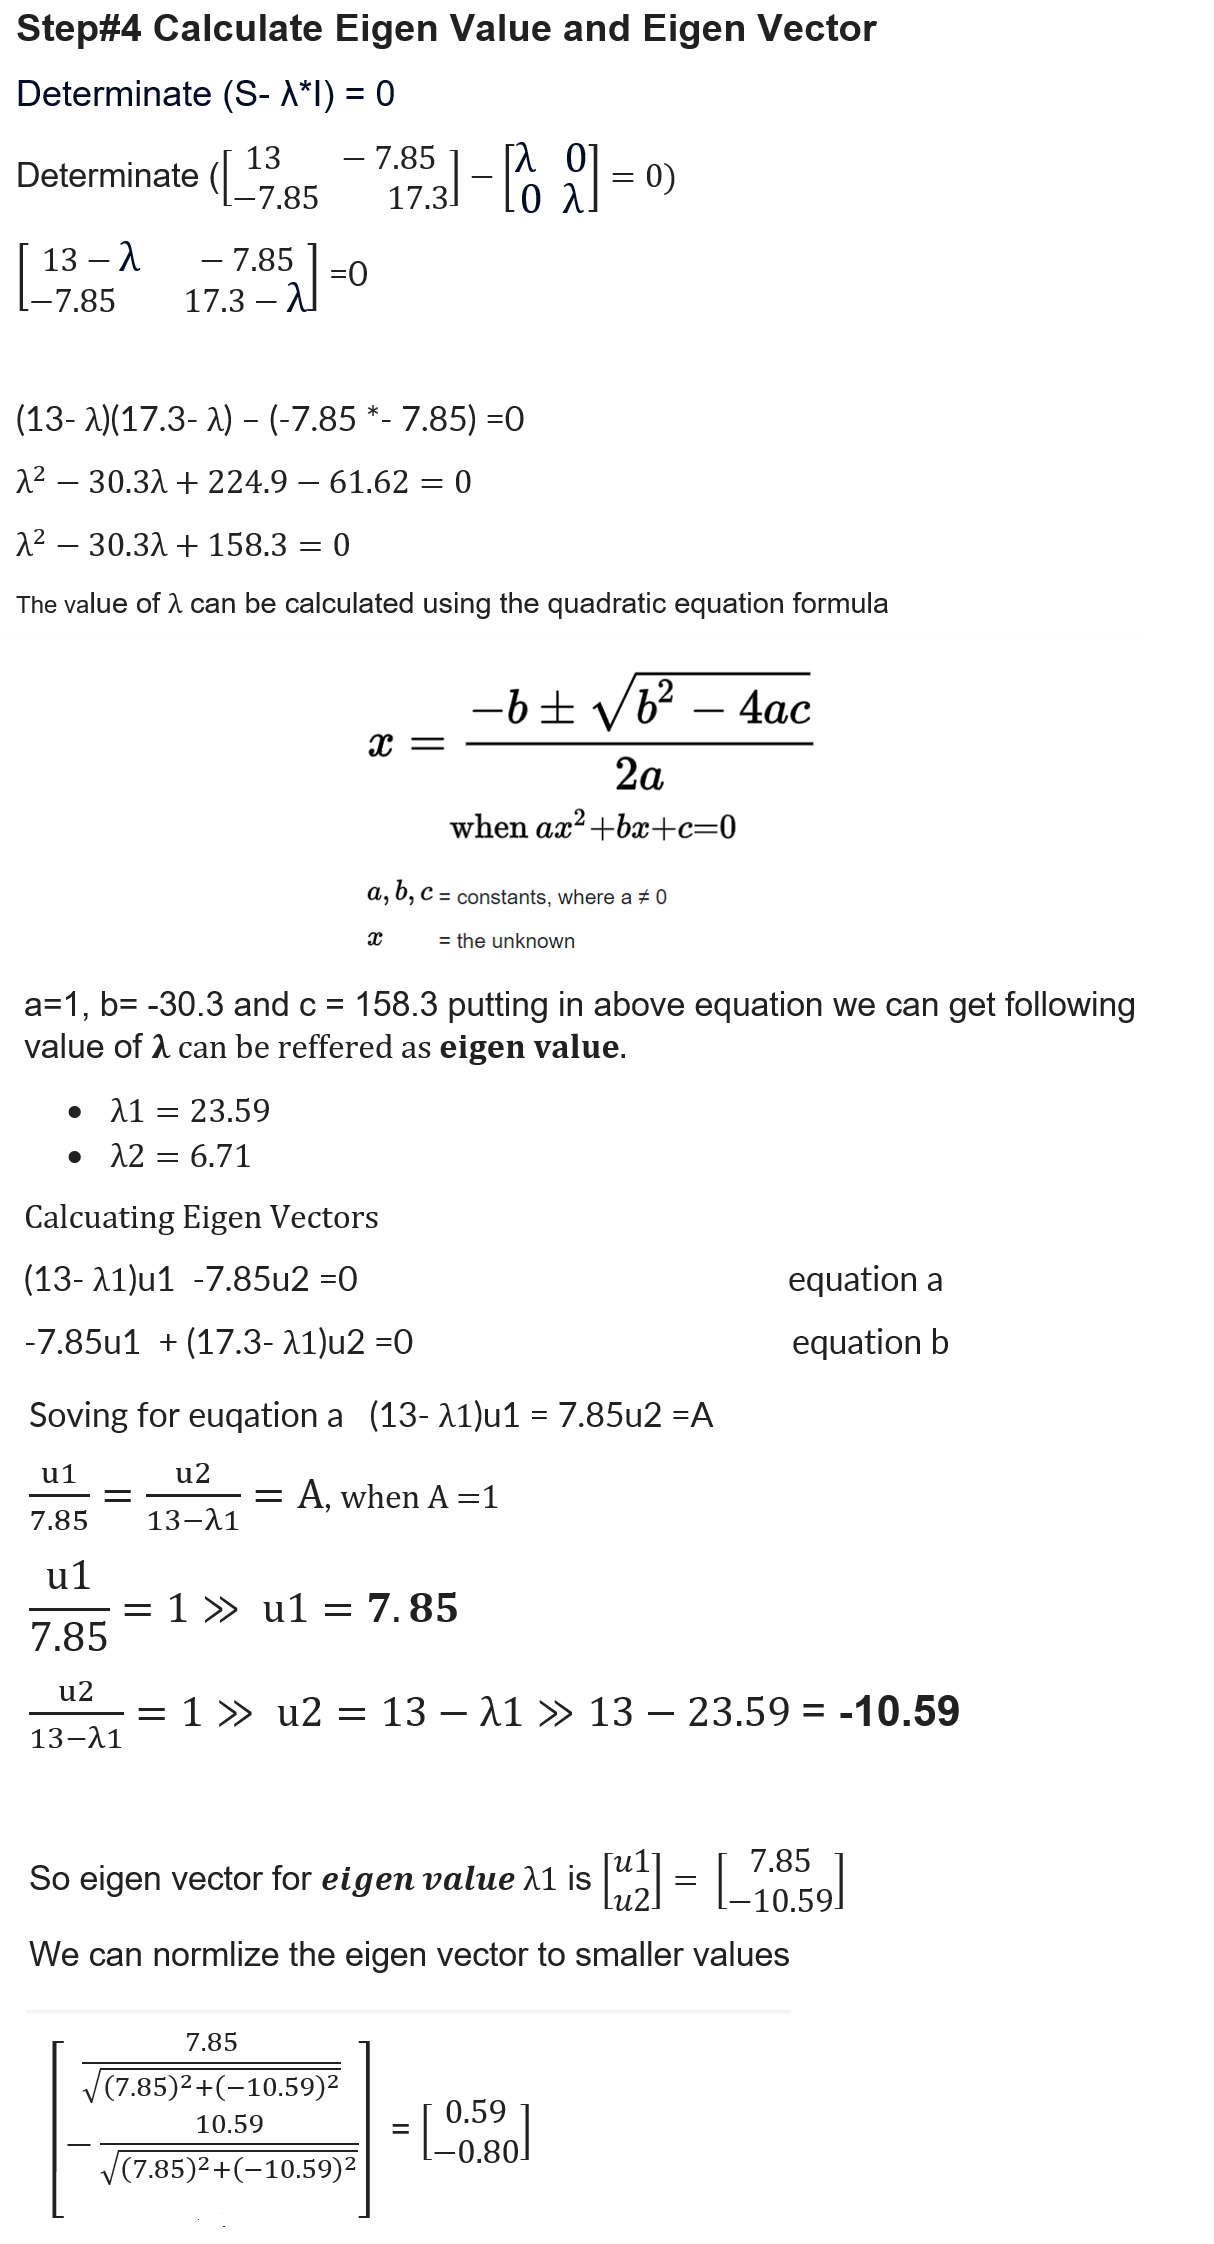
- Calculate the Eigen value and Eigen Vectors
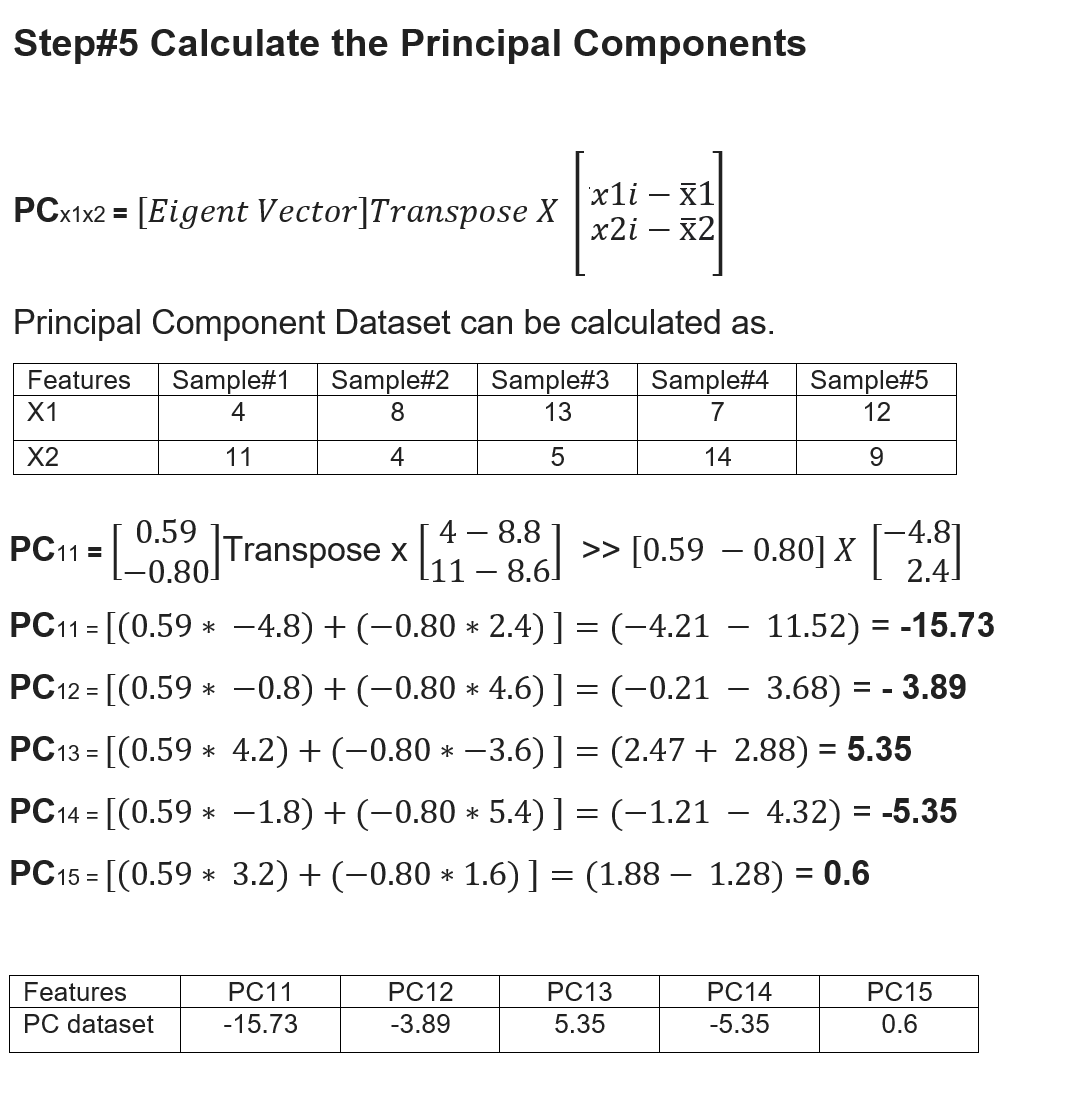
- Calculate PCA and Plot
Applications of PCA Analysis
- In Machine Leaning, PCA is used to visualize multidimensional data.
- In healthcare data, It can explore the factors assumed to be very important in increasing the risk of any chronic disease.
- PCA helps to resize an image.
- PCA is used to analyze stock data and forecasting data.
- PCA can analyze the patterns in high-dimensional data sets.
Advantages of Principal Component Analysis
- Easy calculation
- It speeds up ML computing and algorithms.
- PCA prevents predictive algorithms from data overfitting problems.
- PCA enhance performance of ML algorithms by eliminating unnecessary correlated datasets.
- PCA helps in reducing noise in the dataset that cannot be ignored automatically
Example to Calculate Principal Component
Related Topics
References